Welcome to the official website of Hubei Wentai New Materials Co.,ltd.

November 1, 2022 - running status of the plastic products industry in our country
Upload Time:
2023-01-10
From January to November 2022, the total output of enterprises was 70.8333 million tons, down 3.85 percent year-on-year.From January to November, exports of plastic products totaled $98.19 billion
From January to November 2022, the total output of enterprises was 70.8333 million tons, down 3.85 percent year-on-year.From January to November, exports of plastic products totaled $98.19 billion, up 10.4 percent year on year, according to the General Administration of Customs.Overall look, plastic processing industry in China under pressure, restore situation clear bottoming, exports year-on-year growth.
一、Yield Analysis -- At dawn, keep "smiling"
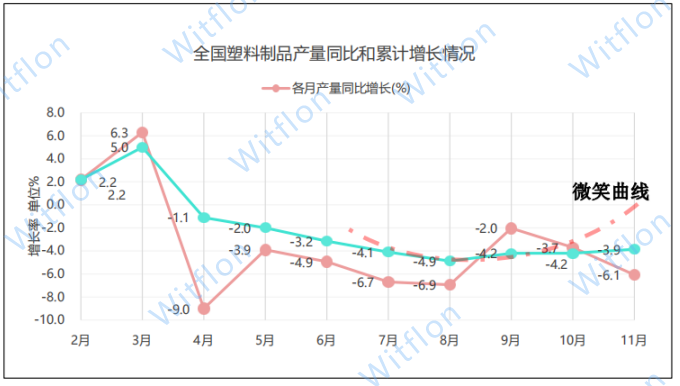
In November 2022, the domestic epidemic rebounded in a large area, and the "triple pressure" of shrinking demand, supply impact and weakening expectations increased, which significantly restricted the operation of the industry. In many places, logistics was blocked, production was interrupted and sales were not smooth, and monthly output was still down year-on-year. From January to November, the national cumulative output of plastic products was 70,833,000 tons, down 3.9% year on year, and the decline continues to narrow. Industry colleagues braced for unity, struggled forward, withstood multiple pressures at home and abroad exceeding expectations, and the trend of bottoming and recovery was gradually obvious. With the gradual relaxation of the epidemic policy in December, the "smile curve" of the industry's cumulative output is expected to fill the last corner of the mouth after a brief adjustment, opening the road to recovery and development of the industry.
The growth of the national monthly output and cumulative output of plastic products is shown in the following figure:
II、Management analysis - cost reduction and efficiency improvement
In November 2022, the number of enterprises above designated size in the national plastic products industry continued to record positive growth, and the trend of steadily increasing industry concentration continued. The growth rate of the proportion of loss-making enterprises and the amount of loss decreased steadily from the beginning of the year to now, especially in the second half of the year has been effectively controlled. In the turbulent year of 2022, as the mainstay of the industry, enterprises in the regulatory industry have risen to the challenge, actively innovated the layout, and continuously improved the operating efficiency, making great contributions to the sustainable and high-quality development of the industry as a whole.
From the rules of the enterprise revenue, cost, profit and other conditions, from January to November, the total profit decline of the plastic products industry narrowed month by month, to November, the total profit was basically flat. On the one hand, it carries out technological innovation and product upgrading, on the other hand, it optimizes labor expenditure and controls raw material cost, so that the growth rate of operating cost decreases month by month and the profit rate of the industry increases gradually.
From the situation of assets and liabilities, the total assets of enterprises on the rule of steady growth month by month. At the same time, the year-on-year growth of assets and liabilities showed a downward trend of shock, but the growth of assets has been higher than that of liabilities, to ensure the internal power of increasing industry assets.
III、Distribution of provinces - stable development, coastal lead
The production of plastic products is mainly concentrated in Guangdong province, Zhejiang Province, Fujian Province, Jiangsu Province and other coastal developed areas. From January to November, the output of Guangdong Province was 12.468 million tons, accounting for 17.6% of the national total, and the output of Zhejiang Province was 11.358 million tons, accounting for 16.0%, leading the output of all provinces and regions.
From January to November, the total output of plastic products in the top ten provinces was 56.263 million tons, accounting for 79.4% of the whole country.
|
State |
Cumulative production from January to November (ten thousand tons) |
proportion |
|
Guangdong |
1246.8 |
17.6% |
|
Zhejiang |
1135.8 |
16.0% |
|
Fujian |
635.4 |
9.0% |
|
Jiangsu |
528.4 |
7.5% |
|
An hui |
424.2 |
6.0% |
|
Hu bei |
395.1 |
5.6% |
|
Shandong |
329.3 |
4.6% |
|
Si chuan |
325.3 |
4.6% |
|
Hubei |
310.8 |
4.4% |
|
Chong qing |
295.3 |
4.2% |
|
Total of top 10 provinces |
5626.3 |
79 |
IV、Export analysis - Environmental deterioration, the growth rate turned down
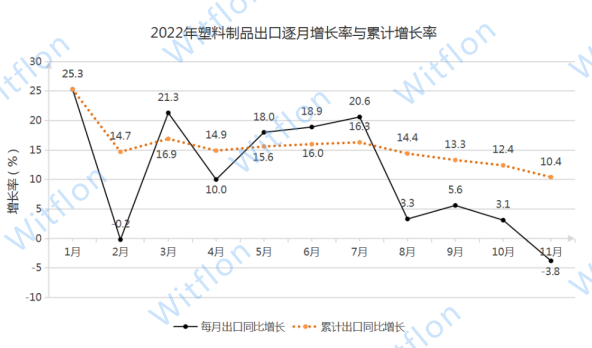
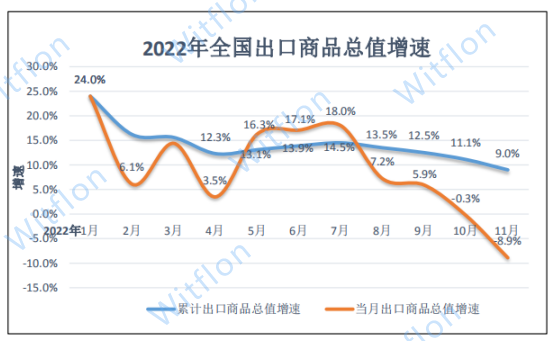
According to the data of the General Administration of Customs, the growth trend of the export of plastic products reached a peak in July, and then the growth rate returned to single digits. In November, as the international environment became more complex and severe, the contraction of external demand further appeared, the export of plastic products turned from an increase to a decline, and the overseas market competition became more fierce. The cumulative export growth rate from January to November was 10.4%. Superimposed and compared with the national commodity export growth chart, from the monthly export situation, the decline in the growth rate of plastic products is not an isolated case, the overseas market situation still continues to deteriorate, which will have a significant impact on the product structure and market strategy of domestic enterprises.
The monthly export amount and cumulative export of plastic products are as follows:
Relevant News


Hubei Wentai New Material Co., Ltd.
ONLINE MESSAGES
Quick Links
CONTACT US
Address:Economic and Technological Development Zone, Xinhe Town, Hanchuan City, Xiaogan City, Hubei Province, P. R. China
E-mail:rose@wentaiptfe.com
Tel:+86-13729949934
Copyright © 2023Hubei Wentai New Material Co., Ltd.